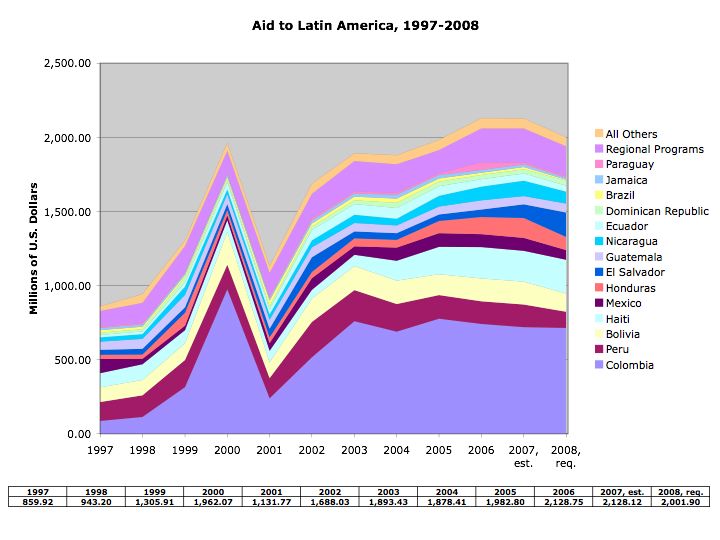
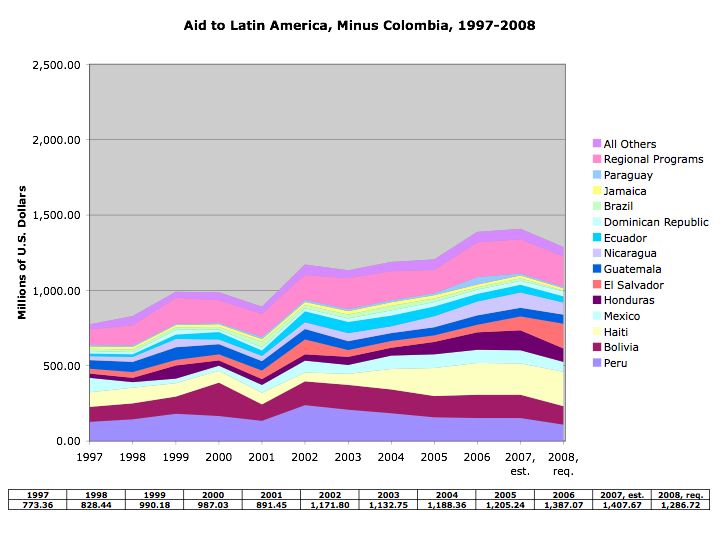
For a clearer view, the original post from Adam Isacson, here. Note that the scales are the same for each pair of charts, in case you thought there was distortion.
Military and Police Aid to Latin America, by Program, 1997-2006:

Military and Police Aid to Latin America by Program, Minus Colombia, 1997- 2008:

--------------------------------------------------
Aid to Latin America, 1997-2006:

Aid to Latin America, Minus Colombia,1997-2006:


No comments:
Post a Comment